Two Projects in Data Viz Intro Course
My Role
Researcher Designer (Individual Work)
Timeframe
2019.02.27 - 2019.04.23
Link
Tool
Adobe Illustrator Excels Flourish
There are two projects I made in Data Viz course last year. This was also the first time for me to play with data visualization.
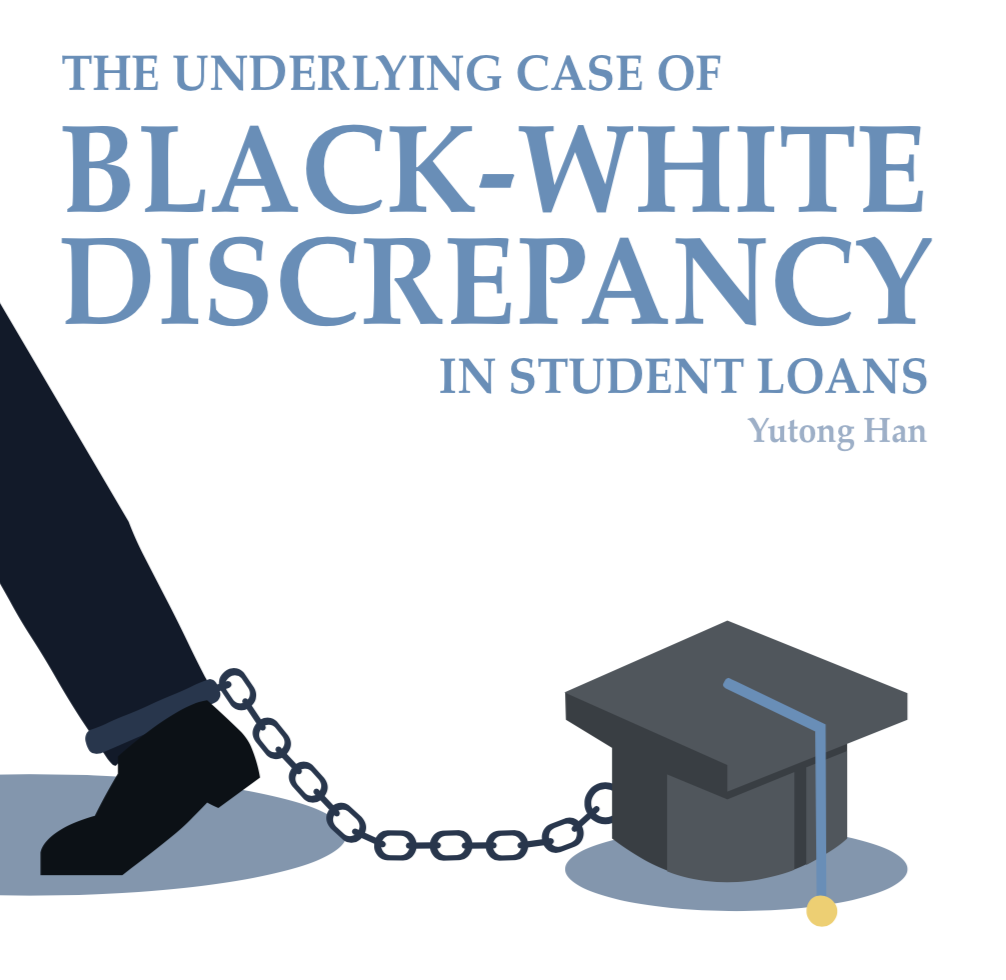
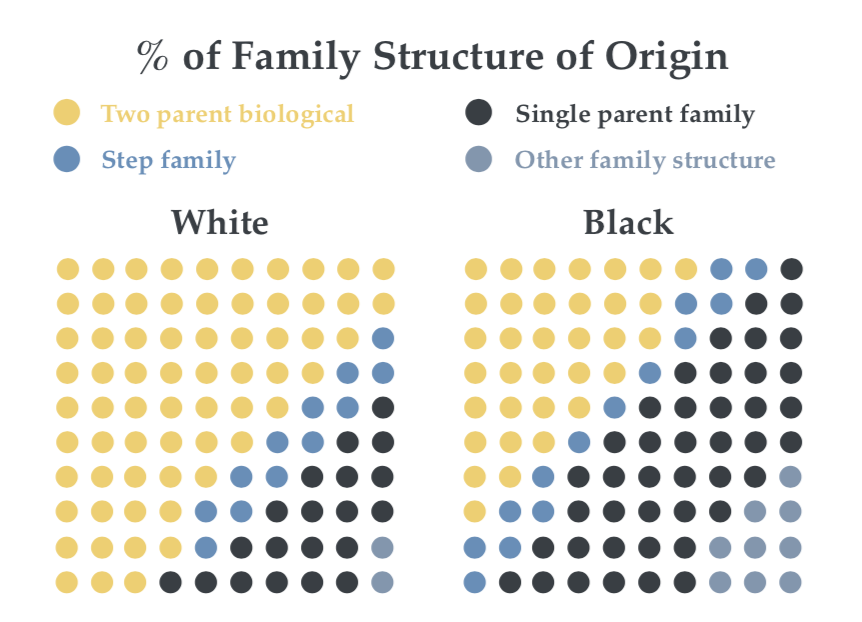
#1 The Underlying Case of Black-white Discrepancy in Student Loans
The project is about the family, policy and economic factors behind the black-white discrepancy in student loans.
I collected data from some paper published in Google Scholar, then used Flourish to create charts, added them into Adobe Illustrator. After that, I drew icons and simple paintings, combining them together.
There are print and mobile versions for the project:
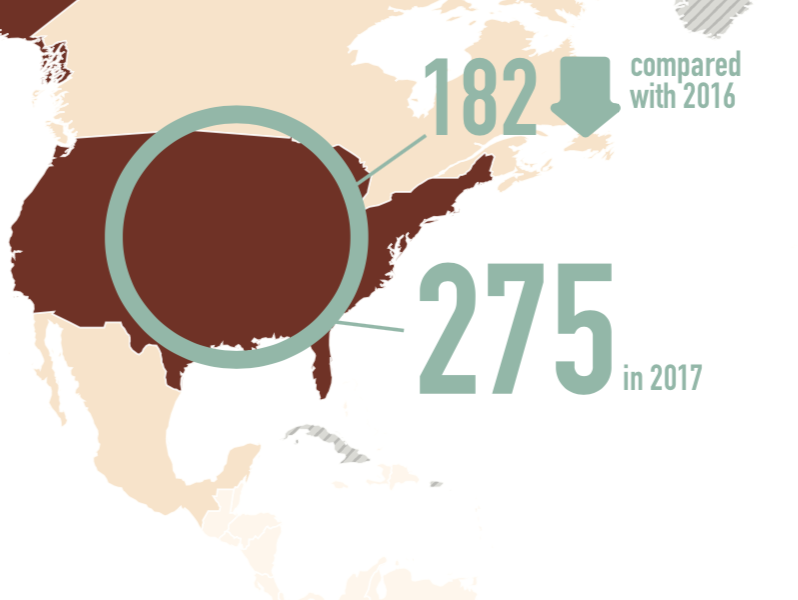
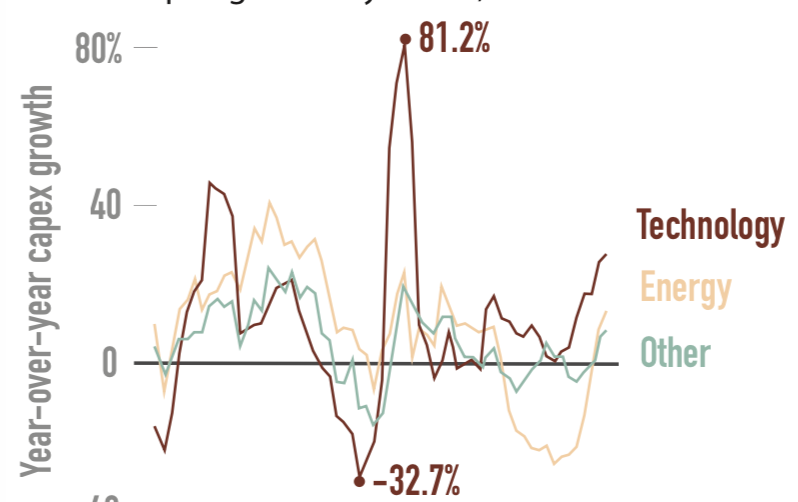
#2 An In-depth Look at Global Investment Trends and Prospects
The project is about the trend of global foreign investment in 2017, EM vulnerabilities and the tendency of equities, commodities, and currencies, thematic investing.
I collected data from the white book published in BlackRock, then used Flourish to create charts, added them into Adobe Illustrator.
There are print and mobile versions for the project:
Thank professor Alberto Cairo, he guided me into the road of data visualization. For me, he is a spiritual mentor.